Suitable representatives for a set of reviews

As we mentioned in the previous post, our team is working on a project to help you make decisions about buying different products and services. We try to help users create an objective view of the specific items they want to buy by analyzing published reviews of other users. Currently, we’ve downloaded enough reports and product articles in Czech and English language to analyze individual views. In the first phase it was necessary to adapt the obtained texts to the form suitable for analysis.

It was necessary to divide the documents into individual sentences, because users often present more ideas in one document and evaluate more criteria. The next step was to remove insignificant words that do not bring any or just little information value. For example, clutches, prepositions, web addresses, and so on. In this step, we also used our own POS analyzer, which assigns the words in sentence word types, and our own dataset with stop words. In particular, nouns, adjectives and verbs were interesting for us. Subsequently, we worded the words into their basic shapes, by specifying the roots of words.

We have transformed the edited documents into vector shape using tf-ifd and then split them into clusters with the same themes using k-means methods. We have managed to identify approximately diversified clusters with a high degree of internal integrity. Identified topics were related to the main parameters of the product segment surveyed.

The clusters created for the whole segment, based on expert articles, were then used to classify product reviews. From identified clusters for individual reviews, we chose those with the highest predictive value – and are presented as a suitable representative for a given set of reviews. The result of the analysis is shown in the example below.

Jan Přichystal

Walk forward test of correlated pairs

In today’s post, we are returning to the Relative Value Approach topic, where we have put a methodology for analyzing stocks, in particular stock couples that show co-movement. We will use this co-movement to create a market-neutral trading strategy (in this case pair trading).

In the last post we introduced the part of the application that searches in the given stock titles and selects those whose logarithmic price differences are mutually correlated. However, this result is static, valid for the moment we run the application. The user will also be interested in the stability of these pairs (or their correlation) over time. Therefore, the application is extended by a walk forward test, which is testing the development of correlated pairs over time.

Methodology

A non-anchored test is performed within the walk forward test. The beginning and the end are scrolling, ie the test window is not extended. As in the previous case, batching is calculated by linear correlation of logarithmic price differences.

Computation

For each pair of in / out-sample correlation thresholds, a walk-forward test was performed:

  • Each walk forward test is a set of partial tests for different walk-window lengths (walk-windows ranging from 2 years to 20 years with a 1 year step)·
  • Each walk-window has a different length of in / out-sample (1 – 20 years, with 1 year step)·
  • The start of in-sample section has been shifted from the beginning of the data by the length of the out-sample section (eg, the 5-year test starts from 1997 to 2013, ie the end of 2018)·
  • The “survival” of the pairs in each walk-window was monitored, ie the number and / the proportion of those in-sample pairs that were also identified in the out-sample section·
  • For example, 80% means that 10 pairs were found in the in-sample, in out-sample were found 8  of these pairs.

Results

The heatmap summarizes the walk-forward test results for a pair of correlation thresholds (in-samle and out-of-sample data). Each stripe of numbers parallel to the main diagonal in the figure represents the results of a set of tests for a certain walk-window length (the sum of the numbers on X and Y is the window length).

The individual boxes show the results for each combination of in-sample and out-sample window lengths. The horizontal axis (X) shows the in-sample window lengths, the vertical (Y) out-sample windows. E.g. the values ​​for the 5-year window test are the points with coordinates (X, Y): (1, 4), (2, 3), (3, 2), (4, 1). Missing fields below the main (or secondary – see above) diagonal mean that no pair in walk-window in the in-sample was found in any of tests. The shorter the walk-windows, the more times they can move over the full length of the data, ie the more partial tests take place, and thus the resulting aggregate value (average, median, etc.) is more robust.

The more favorable (desirable) results are darker, unfavorable lighter, each metric has its “color” (average – blue, median – green, test properties – red, range – purple).

Mean

In the first image, in the area of ​​narrowing “1” line near the main diagonal, the survival of couples are extremely negative (0 or crossed out) as well as positive (100%). The area copied the narrowing line of “1” in the number of tests performed (the first red chart), ie the tests performed only once (due to long out-sample / sliding windows). The “XOM-CVX” pair is almost always the result, so it’s the strongest pair across different seasons.

Median

The figure below shows similar results as in the previous case, only the “survival rate with the highest frequency” is calculated instead of “average survival rate”. In other words, the average is replaced by median.

Conclusion

The output of this application function is robustness testing, or better stability of pairs over time. Let’s take an example when a user of the application selects to date a list of couples which are suitable for pair trading.

Then the user thinks about the list and thinks about how the list would change if the export was done yesterday or a year ago … The answer is just a walk forward test that tracks and evaluates changes in the list of pairs over time. By using this feature, the user recognize that XOM-CVX (Exxon Mobil Corporation and Chevron Corporation) is one of the pairs with the strongest interrelationship between the analyzed assets.

Michal Dufek

Earnings Annoucement Analysis

Besides research-related and data analysis activities, our team also deals with automation and simplification of analytical processes. In today’s post, we would like to introduce the first type of report – quarterly earnings announcement and its analysis.

The report follows the impact of the announced Earnings (with the quarterly period) on the price on the selected assets. Let’s take Deutsche Boerse AG as an example.  An investment analyst or a portfolio manager responsible for the decision-making process shall receive the necessary information:

  • Earnings Announcement date
  • Earnings Announcement time
  • Comparable Earnings per Share (EPS)
  • Earnings per Share (EPS) current quarter
  • Earnings per Share (EPS) estimated value

The report below gives the analyst as an insight into how strongly and in what direction the market has reacted to the reported results. The sentiment of movements, of course, determines the ratio between the estimated EPS value and the announced value. If the current value is higher than estimated, it’s a „positive information“ and if the current values are lower than expected it’s „negative information“.

The practical use consists of a given overview of how the markets have absorbed information about the published results of the analyzed assets in recent quarters. Next a balance of positive and negative deviations in real values from those brings useful information, indicating whether the expected results are systematically underestimated, in line with the announced results or overestimated.

The report can be used by investments analysts or portfolio managers to receive a quick overview of how the analyzed assets reacted to the Earnings Announcement of the results in past quarters, thus, for example, obtaining information on whether the expected results in the summary are overestimated or undervalued.

Michal Dufek

We have downloaded over half a million user reviews

We will inform you about the milestones we have achieved in analyzing text reviews. Let’s take a look at our research.

Motivation

Our team is currently working on a project to help make decisions about buying different products. A huge amount of opinions and reviews of individual products can be found on the Internet.
These user reviews are distributed across a variety of discussion forums, product rating sites, or specific portals. For a regular user, it’s difficult to find the information needed, get a look at them, and make its own opinion.

Methodology

In order to analyze large amounts of unstructured data, we have decided to use machine learning methods. We want to use these data to identify topics that are important to users and to determine their positive or negative attitudes towards individual product features.

Current status

We are currently working on creating crawlers for downloading user reviews and articles about the selected product group. These crawlers are tailored to the structure of specific sites. Crawlers from these sites get relevant data that can help in analyzing themes and attitudes. So far, we have created eight crawlers, which have helped us to download about half a million user reviews and expert articles about two thousand products in two languages ​​(Czech and English).

Problems solved

We had to deal with several issues when acquiring the data. One of the main ones is the different way of labeling products on different sites. Although it is an identical product, there are differences in names that complicate product pairing. Another problem is limiting the number of accesses to some sites in the form of code captcha. The last issue that needs to be solved is the changing web structure that causes crawlers to fail.

Conclusion

We have a practically closed first phase of the project in which we have defined the task of creating data acquisition tools for subsequent analysis. In the next phase, using machine learning methods, we will work to uncover the topics discussed and attitudes of users.

Jan Přichystal

Text analysis in field of business mediation

Public and private customers increase online spend every year. As new generations of buyers mature there are more and more demands for goods and services available online for suppliers.

In Czech market there are approximately 20 portals that mediate demands with proper suppliers. Customers are promised to find qualified, relevant suppliers that have proper experience and references in exchange for contact details and description of demand. Which is more advanced service than look for proper supplier using web search engines like google.com or seznam.cz but less complex service than using online auction portals that remain domain of enterprise companies purchase departments.

Business mediation portals

Services of mediation portals are free for buyers, yet suppliers are mostly asked for various payments.

When it comes to public customers that are obliged to conduct public tenders in order to find proper supplier – monthly or yearly fees are asked to get up-to-date information about new tenders that appear on thousands of public subject profiles. Such service sends notifications about description and subject of tender to suppliers that match their profile filled during registration and start of service.

Weaknesses of such service are obvious – in case that description and subject of public tender does not match the profile – supplier gets no notification. Which is followed by missing important opportunities in cases that proper description is provided in following attachments and documentation mostly at more complex deals.

In case of private demands suppliers are asked to pay for each demand they are interested in. Such procedure in practice means that suppliers are overwhelmed by small inquires that require payments for contact disclosure.

Mediation by Artificial Intelligence

State of the market remains suboptimal as customers do not get information on the most relevant suppliers (as their demand is shown only to paying ones) and suppliers miss some of the opportunities as well as well as they need to handpick relevant demands for their services.

Artificial Intelligence that would be able to understand:

  • texts of offers of suppliers out of their websites, product information and descriptions of services provided by marketing materials or presentations and
  • texts of inquiries provided by procurement documentation or simply by text generated by customers

has potential to bring significant innovation in the field. Value added may bring:

  • weighted match of inquiry profile and supplier profiles
  • more relevant customer demand and supplier references match
  • checks of qualification criteria for public tenders
  • reduction of administration during registration processes
  • supplier matches that are independent on payments from supplier side
  • valuable market research information

Artificial Intelligence offering

No matter potential benefits our marketing research showed that mediation portal operators have no interest in such innovation in their field.

Our research showed that mediation portal operators are mostly unknown or unavailable – which is understandable as their services do not satisfy many of their clients even though most of businesses have been offered such services (even by more of mediation portals).

Out of mediation portal operators reached none of them develops business by way of product development – preferred way of development is customer acquisition.

Radomír Věntus

The Reviews section launch!

In the introductory article of the Reviews section, we present the Multicriterial Text Analysis Software (MTA) project, which deals with the removal of information asymmetries in news and reviews.

The MTA team of scientists from CYRRUS ADVISORY, a.s. and Mendel University in Brno uses machine learning methods to analyze text in the field of current news and product reviews.

In the following posts, you can look forward to describing the research issues and the results we have already achieved in this area.

Jiří Fuchs

The Relative Value Approach

Introduction

This post aims to give information our team is currently dealing with – a investment approach used by hedge funds and proffesional portfolio managers. There are such investment approaches that do not require crystal balls to expose investment opportunities, but which are base on statistics, economic operators, logical relationships and the professional use of state-of-the-art technologies. A key fact is that there is no use of the prediction of future values for estimating the future direction of the asset analysed, but the approach seeks anomaly (market opportunities) in the relationships of different asset prices among which there is a certain (economic, political, commercial, technical) logical relationship. The result is a investment strategy which does not estimate the direction of the future development of the asset but which is able to identify the business opportunity created in real time.

Motivation

Our goal is to create/find alpha factor that gives an investor an advantage over a normal approach where an investor buys and holds a security until its maturity or sale. One source of this alpha factor is „Relative Value Trading“, which contains many investment approaches, including Statistical Arbitrage, Convertible Arbitrage, Fixed Income Arbitrage, Equity Market Neutral, Spread Trading, Pair Trading. The point of this approach is to track the logical links among the selected assets (we used 30 randomly selected U.S. shares) and the trading of anomalies that appear over time on those relationships.

Data

A wide range of underlying assets (shares, commodity futures, bonds, government bonds and CDS, convertible bonds and their underlying shares) can be used to analyse the Relative Value.

For our initial analysis, we used 30 randomly selected U.S. shares, which are currently mainly used to compile and verify the correctness of the methodology and operating process.

Once the operating process has been detuned, we will also deploy the application to other data sources.

Methodology

The Relative Value Approach is a mean-reverting investment approach where the underlying premise is a stable relationship between two or more assets.

This relationship is identified by a long-term correlation matrix of differentiations of logarithmic price of the assets entering the analysis.

These short-term anomalies provide an alpha factor on which to build a investment strategy used by proffesional portfolio managers.


Table 1: Correlation matrix of significant relationships

XOM JPM GS CVX
XOM 1.000000 0.464594 0.490233 0.879080
JPM 0.464594 1.000000 0.733680  0.489734
GS 0.490233 0.733680  1.000000 0.523985
CVX 0.879080  0.489734 0.523985 1.000000


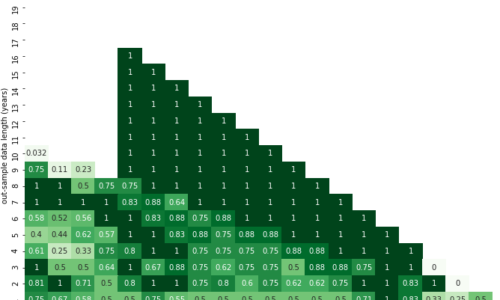
Figure 1: Correlation coeficients heatmap

The chart above illustrate the results of the first step. Of the 30 titles analysed, we identified 2 bilateral long-term relationships formed by JPMorgan Chase & Co. (JPM) with Goldman Sachs Group Inc (GS) and Exxon Mobil Corporation (XOM) with Chevron Corporation (CVX).

In the second step, we culled a short-term sliding correlation with a period of 10 business day, for these two relationships. The goal was to trace short-term deviations from long-term normal which will be further used as a alpha signals for a investment strategy. The results are shown in the charts bellow.


Figure 2: Comovements and short-term disruption in relationship „XOM-CVX“


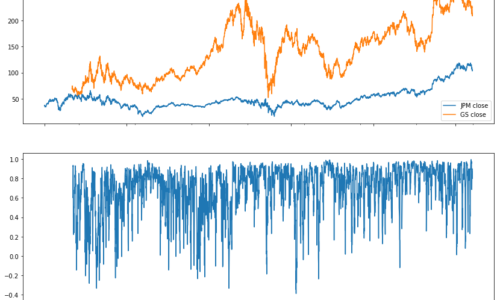
Figure 3: Comovements and short-term disruption in relationship „JPM-GS“

On both lower charts you can see short-term decreases in correlation coeficients, which we consider to be signs of short-term deviations from long-term normal. We regard these short-term deviations as a investment opportunity, the automated use of which will our team further address.

Conclusion

This post aims to outline the idea of one of the investment approaches by hedge funds and professional portfolio managers and to show the results achieved by us. Further steps (robustness and stability checks of the long-term correlation matrix) will be analysed in other positions, which we are curently dealing with in the search for optimisation solutions in assets management in detail, including the technological processes.

Michal Dufek

Our Goal

Our goal is to create a portfolio of financial assets that yields a positive return even at market corrections.We develop a platform that uses Bayesian statistics and AI knowledge (primarily neural networks) to effectively rebalance the portfolio of business strategies (taking into account all aspects of risk management, such as portfolio engagement based on mutually correlated titles, currency, business strategy – all in order to rebalance the portfolio according to the given requirements).

The platform will be able to identify situations where there is low / high liquidity on the market and, in the light of this, to disable / deploy some trading strategies, modify money management, or avoid trading completely.

Output is a bot – an actively managed portfolio that exhibits lower risk (measured by maximum drawdown) with higher yield stability, without active trader / developer intervention. The potential of the platform is to work in multiple versions of the user’s IT capability – from a very variable user environment, where the programmer can create and manage a tailor-made portfolio to a black box (lite version) where the user chooses from several preferred criteria and the bot will, according to selected criteria, compose the portfolio itself.

Jiří Fuchs